A step by step guide on using a Pin Report in Tableau
Contents:
- Common Uses for a Pin Report
- Creating a Heat Map with Tableau
- Analyze Visitation with Tableau
- About the Author

Common Uses for a Pin Report
The Pin Report is an excellent report for visualizing where visitors go to in your study location. It can also be used to quantify what times of day and what days of week are the busiest for the study location. The following steps will walk through how to use the data set to answer both questions.
Creating a Heat Map with Tableau
To start, be sure to have the spatial file of your study polygon handy.
Load both the Pin Report and the spatial file (typically a GeoJSON) into your active Tableau workbook. These two datasets need to be added in as a cross-database join before working with the data. To do that, first load in the Pin report as you normally would. Then select the add option in the top right corner.
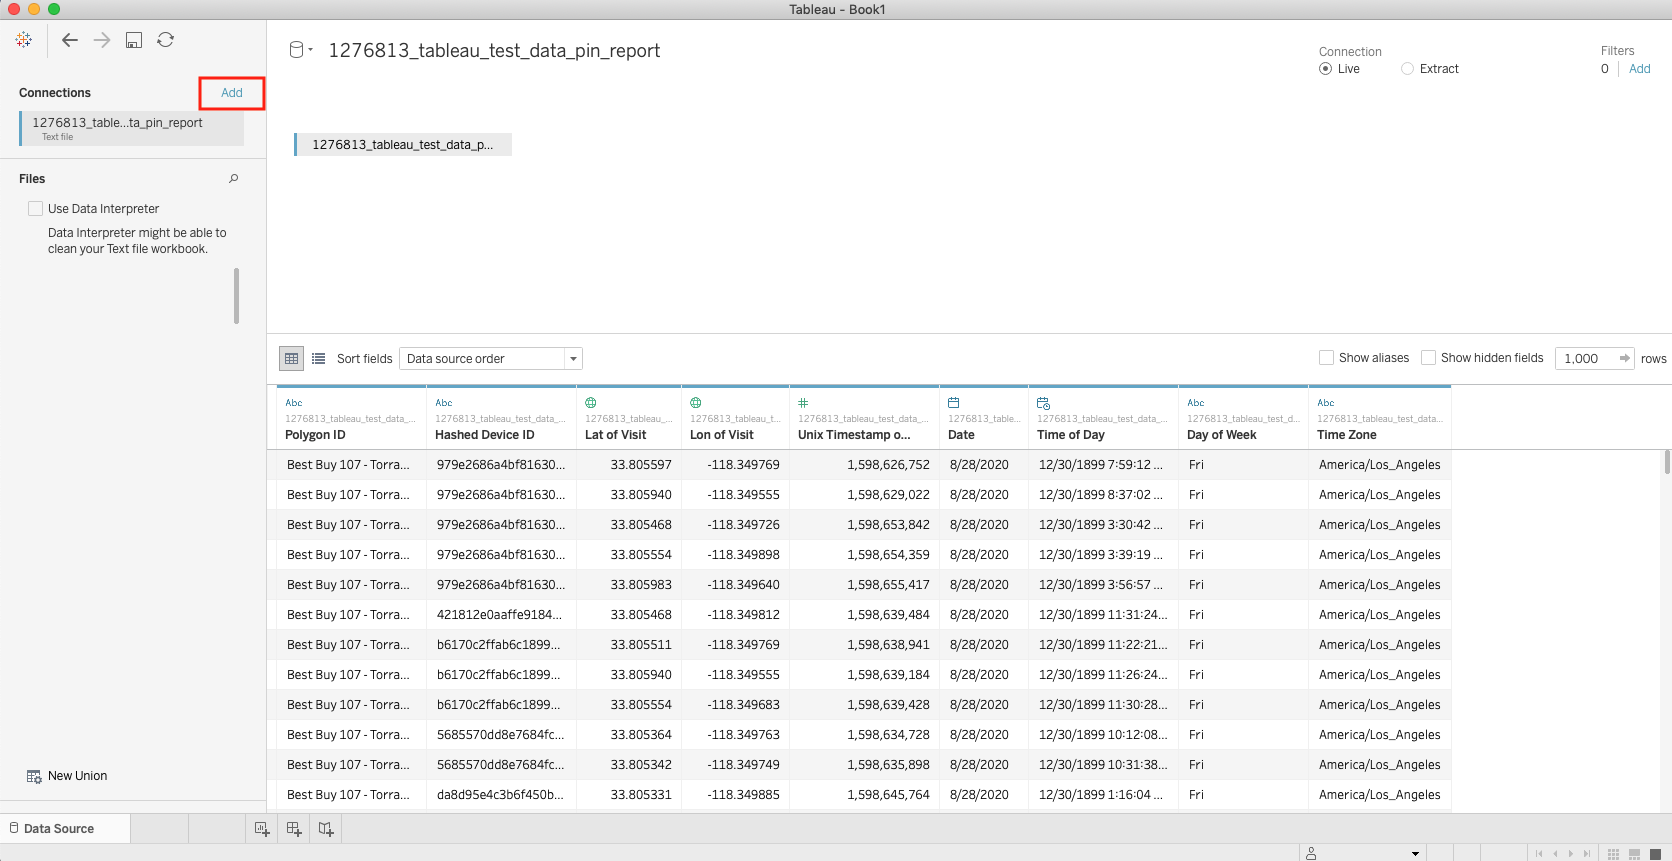
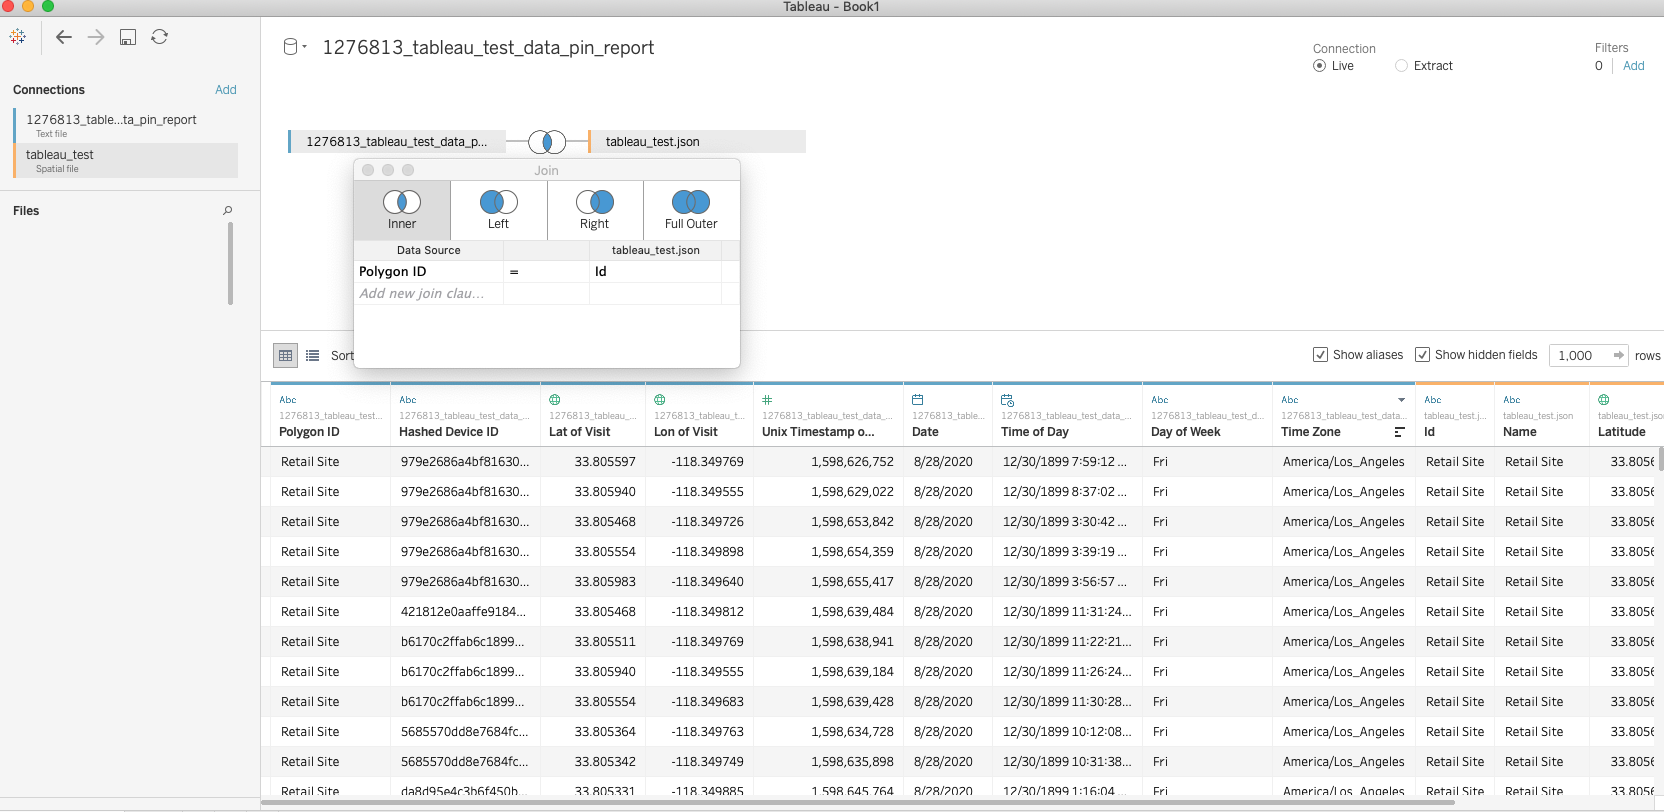
Find and select your spatial file, and then join the datasets on a common key. If the spatial file came from the Polygon Collection Builder tool within Vista, then the join key is simply:
Polygon ID = Id
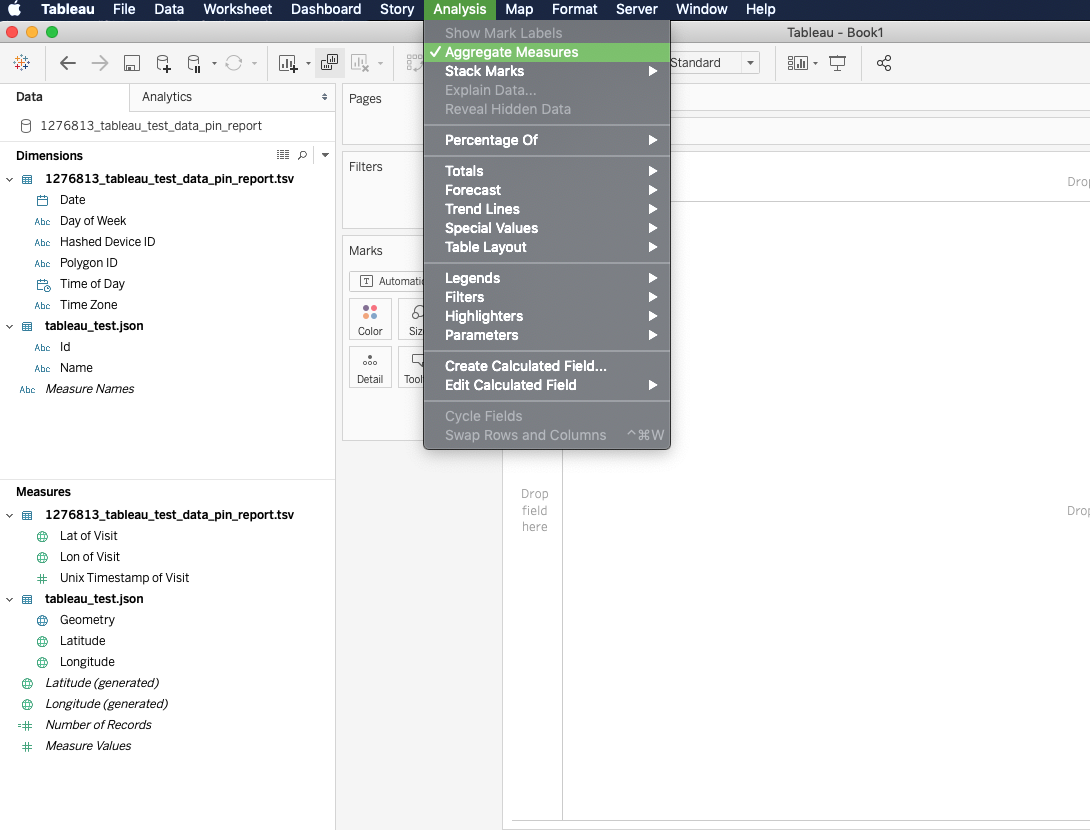
From here, start a new worksheet and be sure to uncheck the Aggregate Measures option by clicking on Analysis in the menu bar and then deselect the Aggregate Measures option.
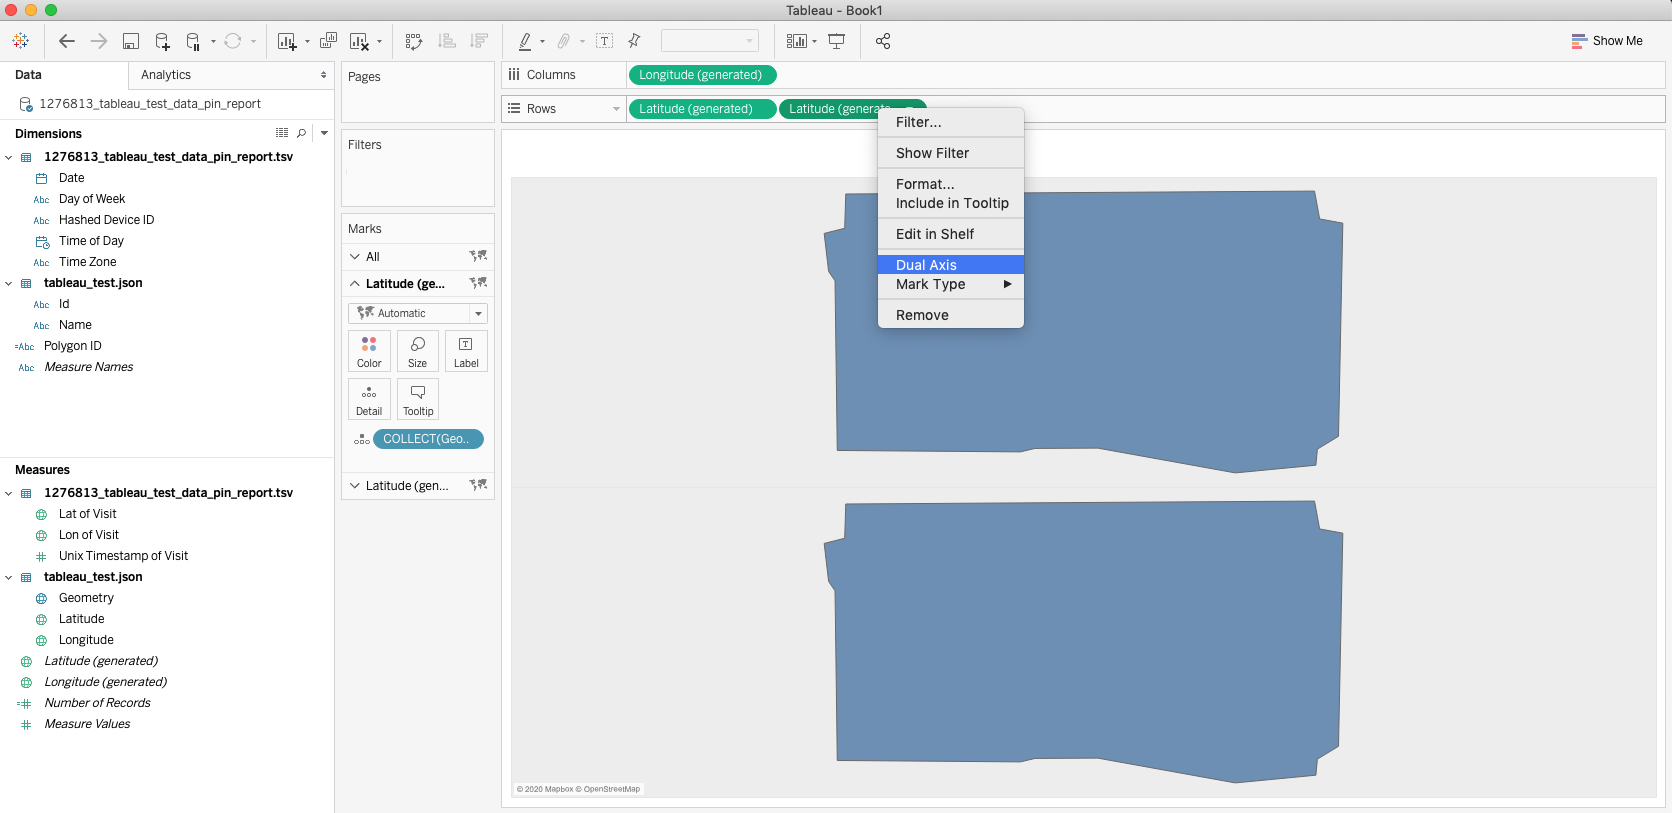
First double click the Geometry measure, which will bring it onto the worksheet canvas. This will populate the workbook with the study location. From here, ctrl-click (or Command+click) on the Latitude (generated) pill in the Rows window and drag it to the right to add another Latitude (generated) pill. Then right click that second pill and select the Dual Axis Option
Doing so will add an additional drop down menu on the Marks card. Click on the bottom drop down menu and replace the Geometry detail object in the card with the Lat of Visit and Lon of Visit measures.
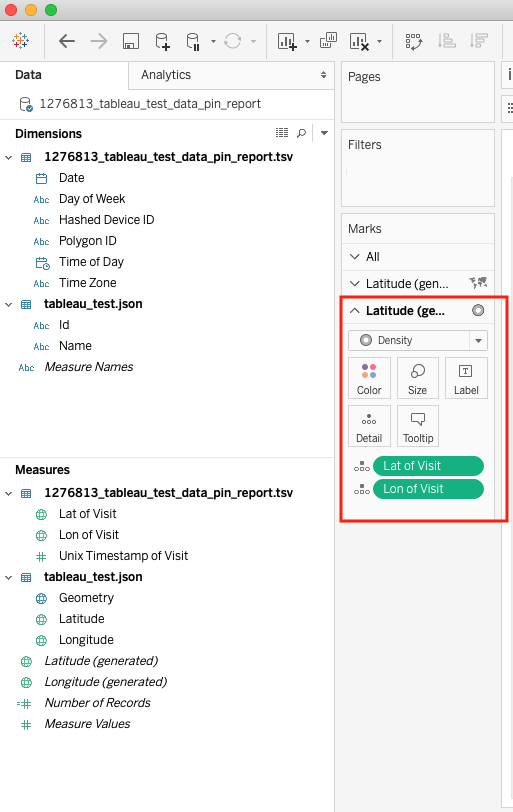
You can then change the marks type from Automatic to Density to create a heat map.
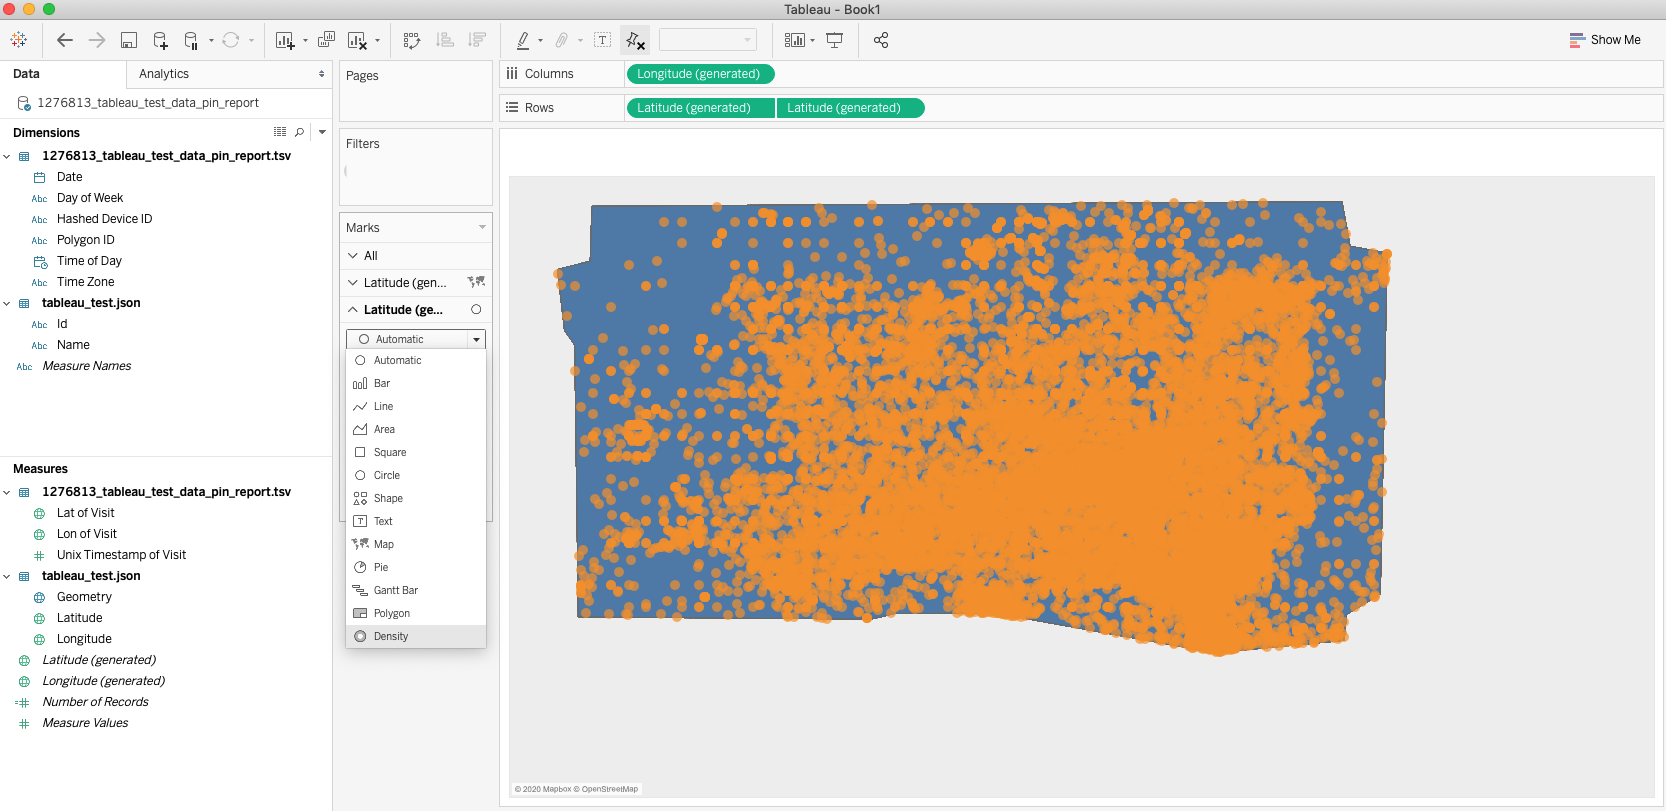
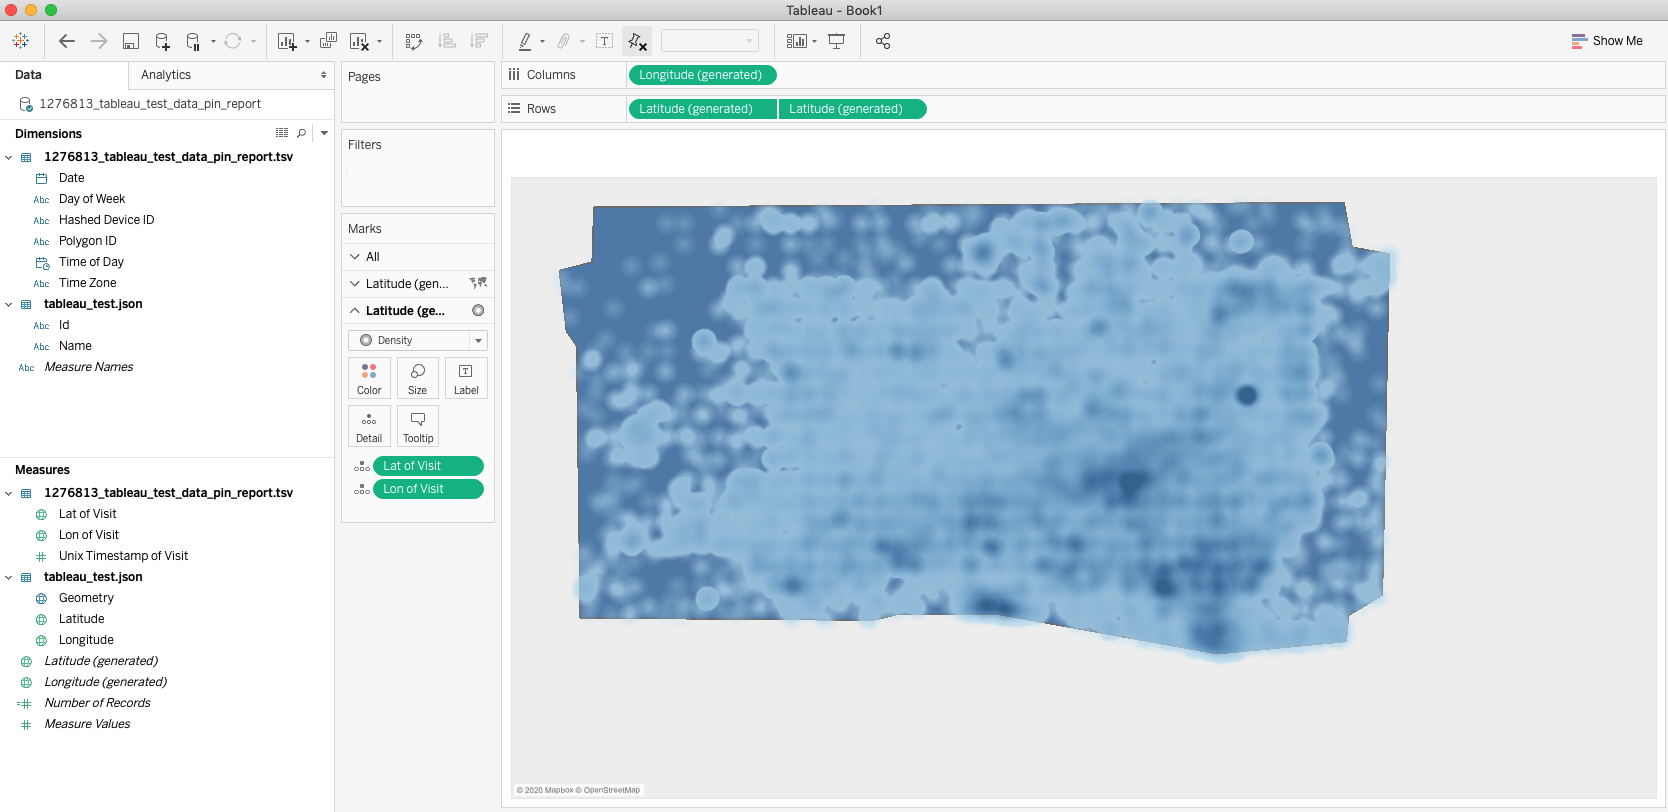
From here, you can change the colors, opacity, and intensity of the data points to suit your needs. You can even change the Background Map to get a better idea of where the hotspots in your location are.

Analyze Visitation with Tableau
Tip: The following steps can also be done with a Zero Point Report. In many cases, a Zero Point report is more simple to use because it tends to be a smaller dataset than the Pin Report. This is because it doesn't contain Latitude and Longitude data, which bloat the data. Otherwise a Pin Report and Zero Point Report are identical. For more info, please reference this page on Zero Point Reports.
To start, load in your Pin Report into Tableau and note the columns that are available to you. The main ones we'll be focused on using are Polygon ID (if your data has multiple polygons), Date, Time of Day, and Day of Week.
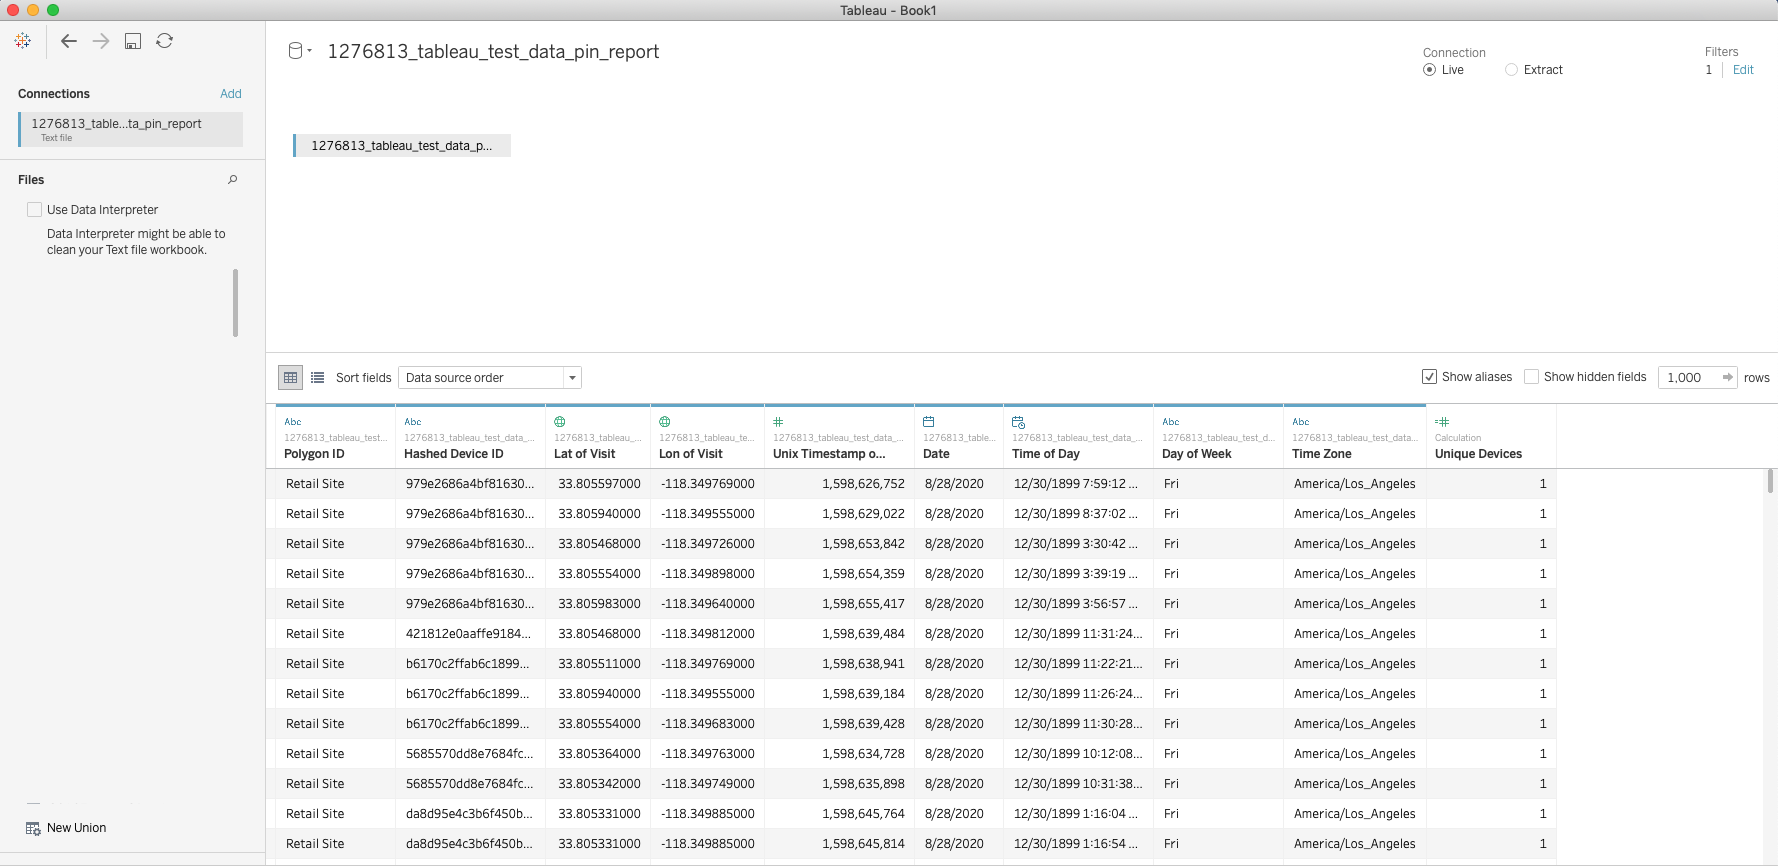
Once the data is loaded in, we can start working with it. Lets begin by creating a Calculated Field called Unique Devices. This will allow us to measure unique device activity throughout our selected time periods.
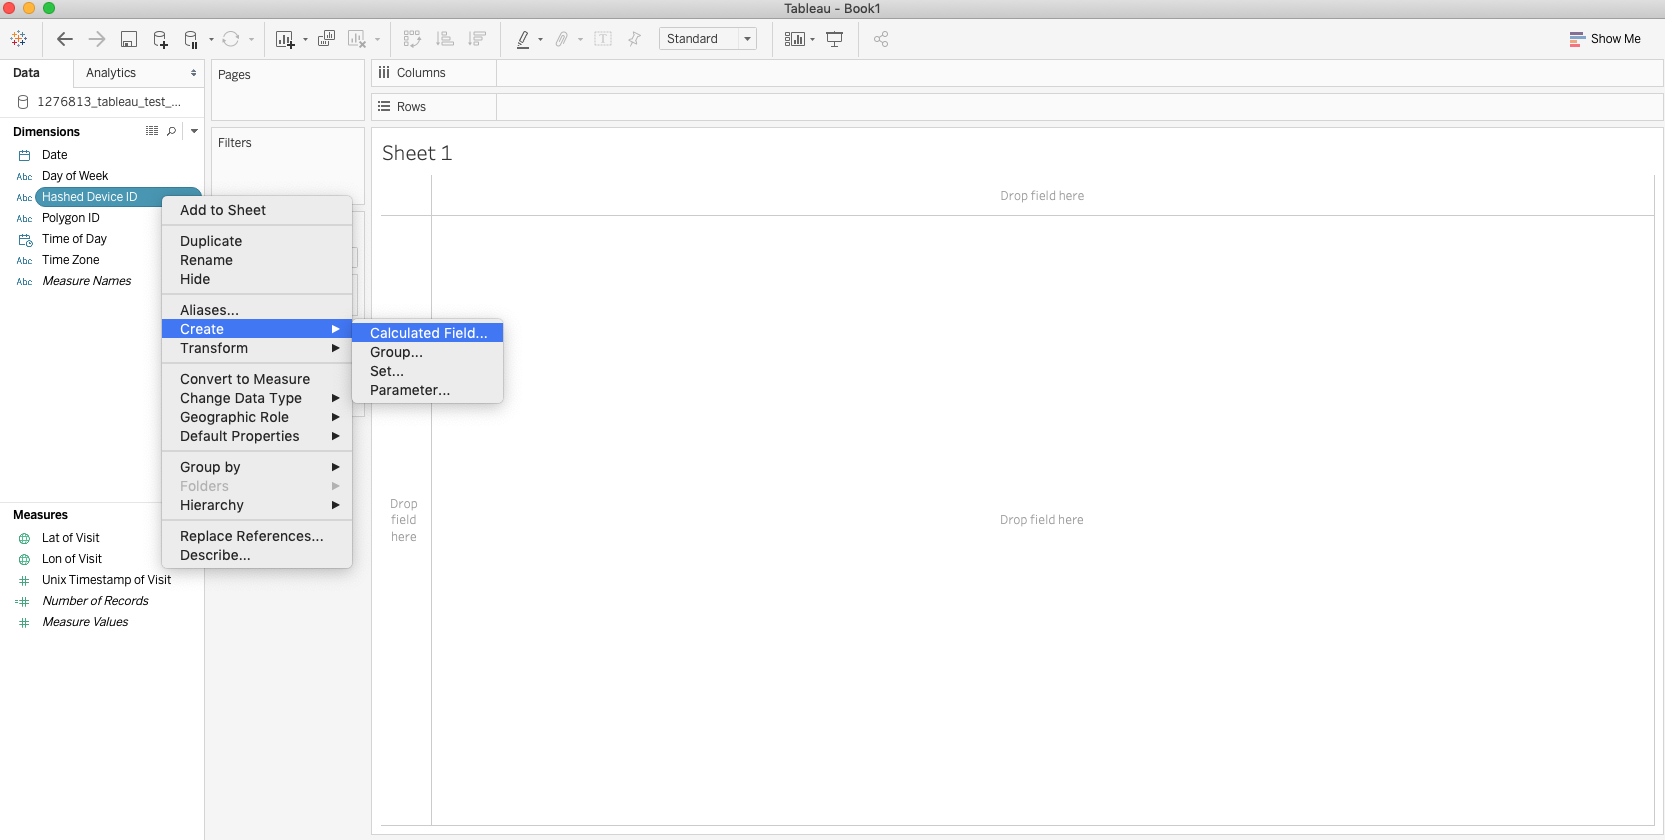
When selected, type in the formula:
COUNTD([Hashed Device ID])
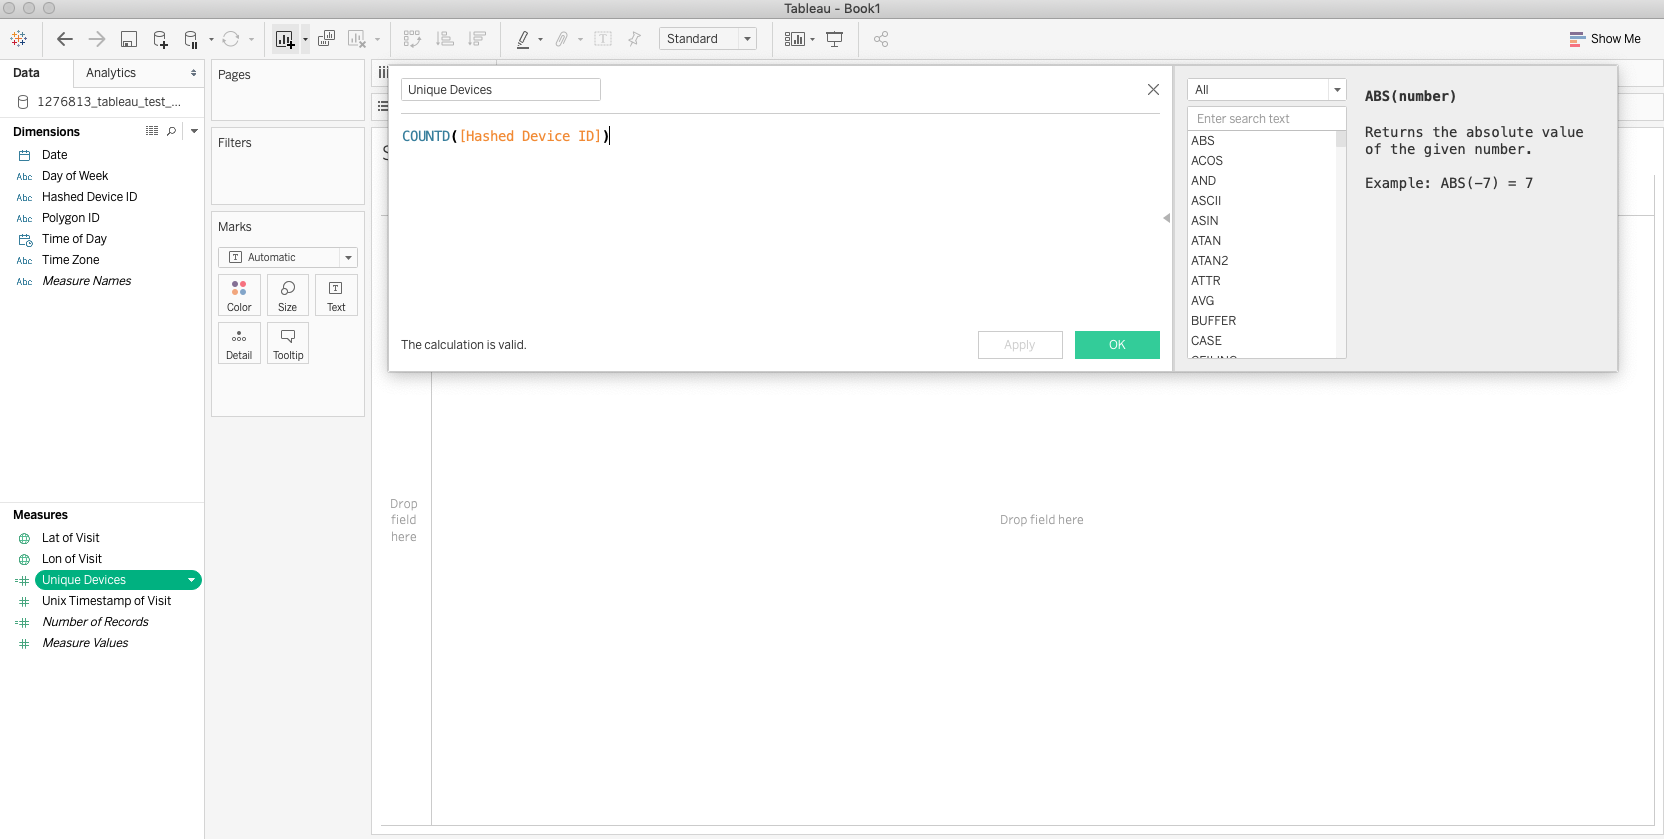
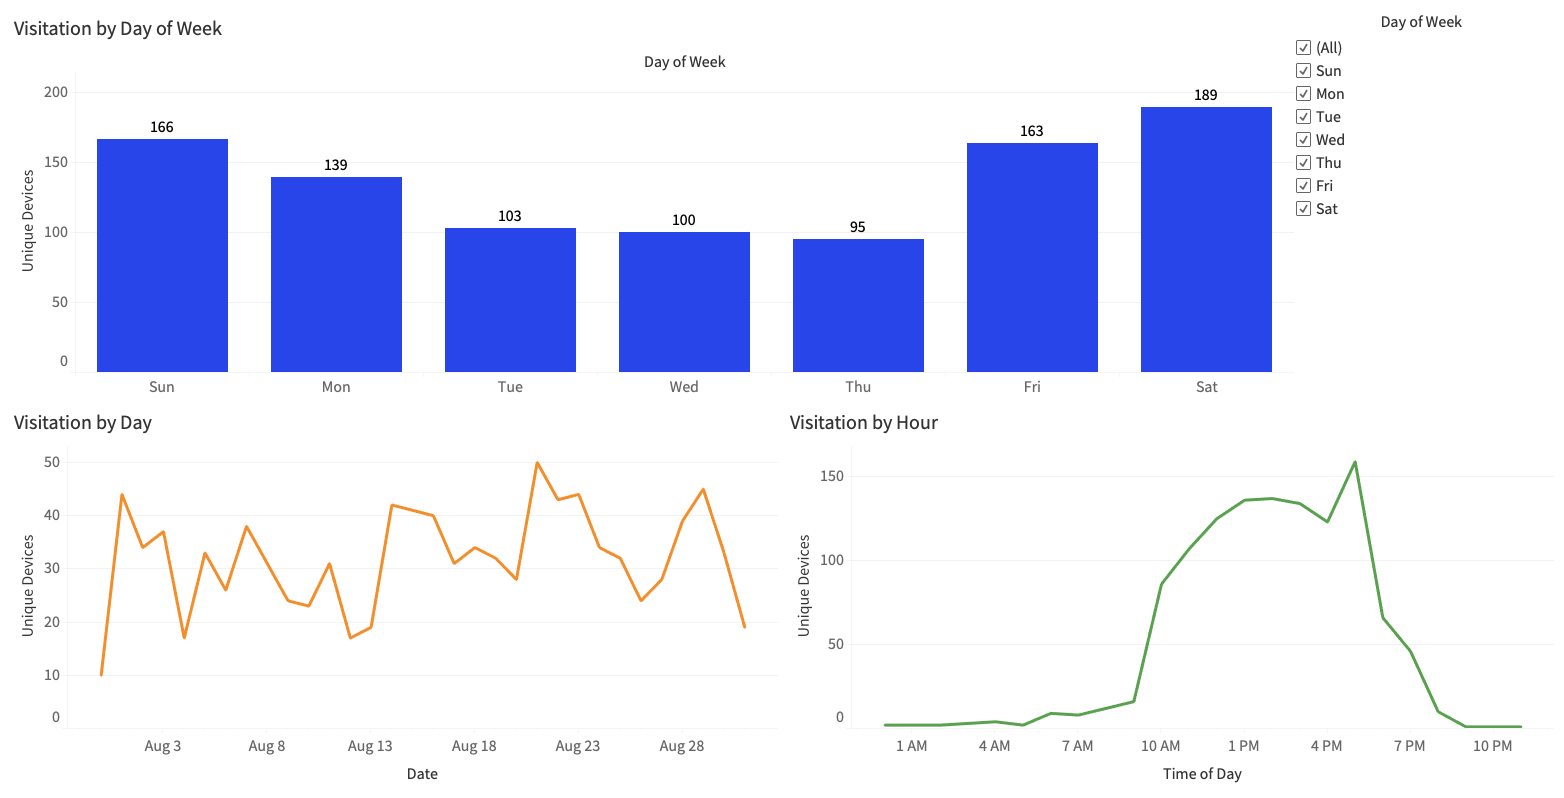
Once this is created, we can click on this new Measure and add it to the Rows shelf. We can then add our different datetime Dimensions to the Columns shelf. Lets add in Day of Week and see what that looks like:
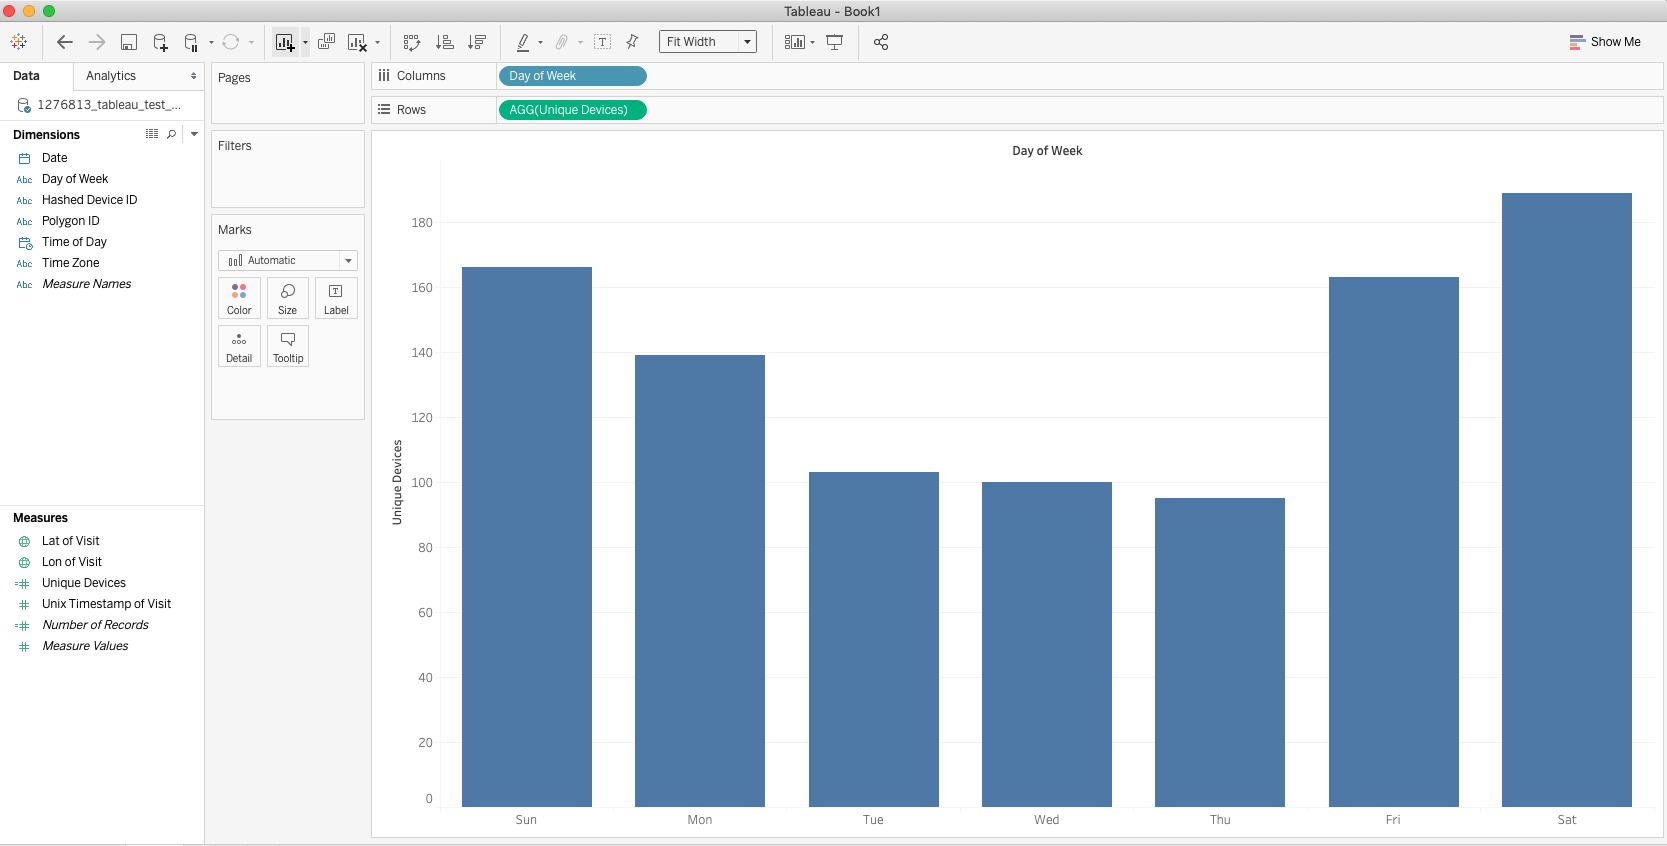
This allows us to see how unique devices travel to our study location throughout the week. Now let's look at date and see what that looks like. To do so, replace the Day of Week pill with Date in the Columns shelf. Be sure to change the data type of Date to a continuous date.
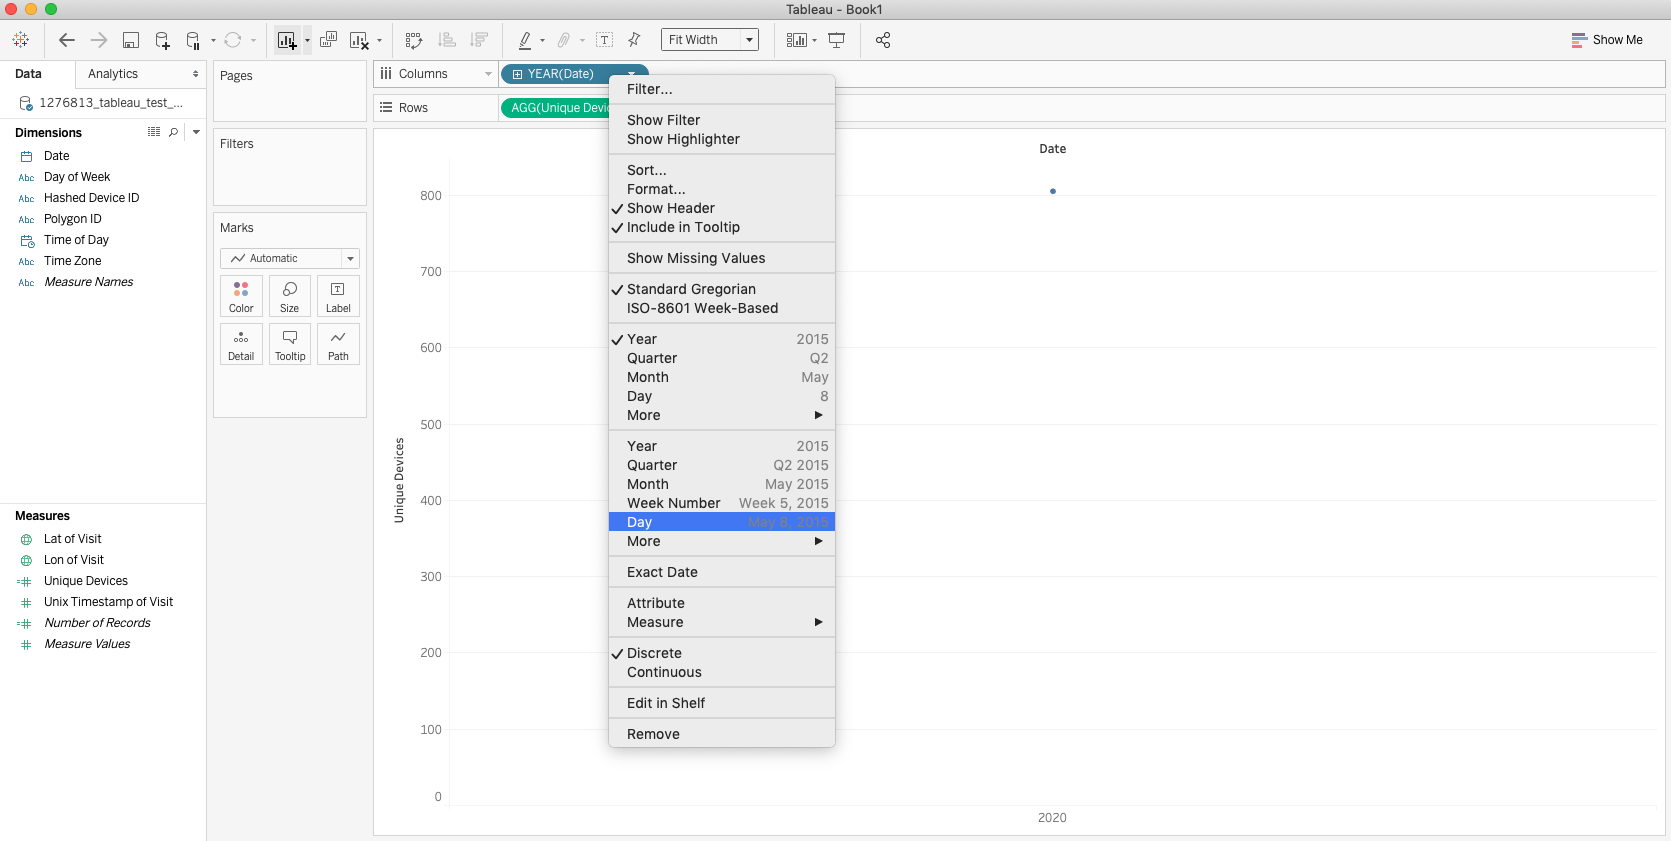
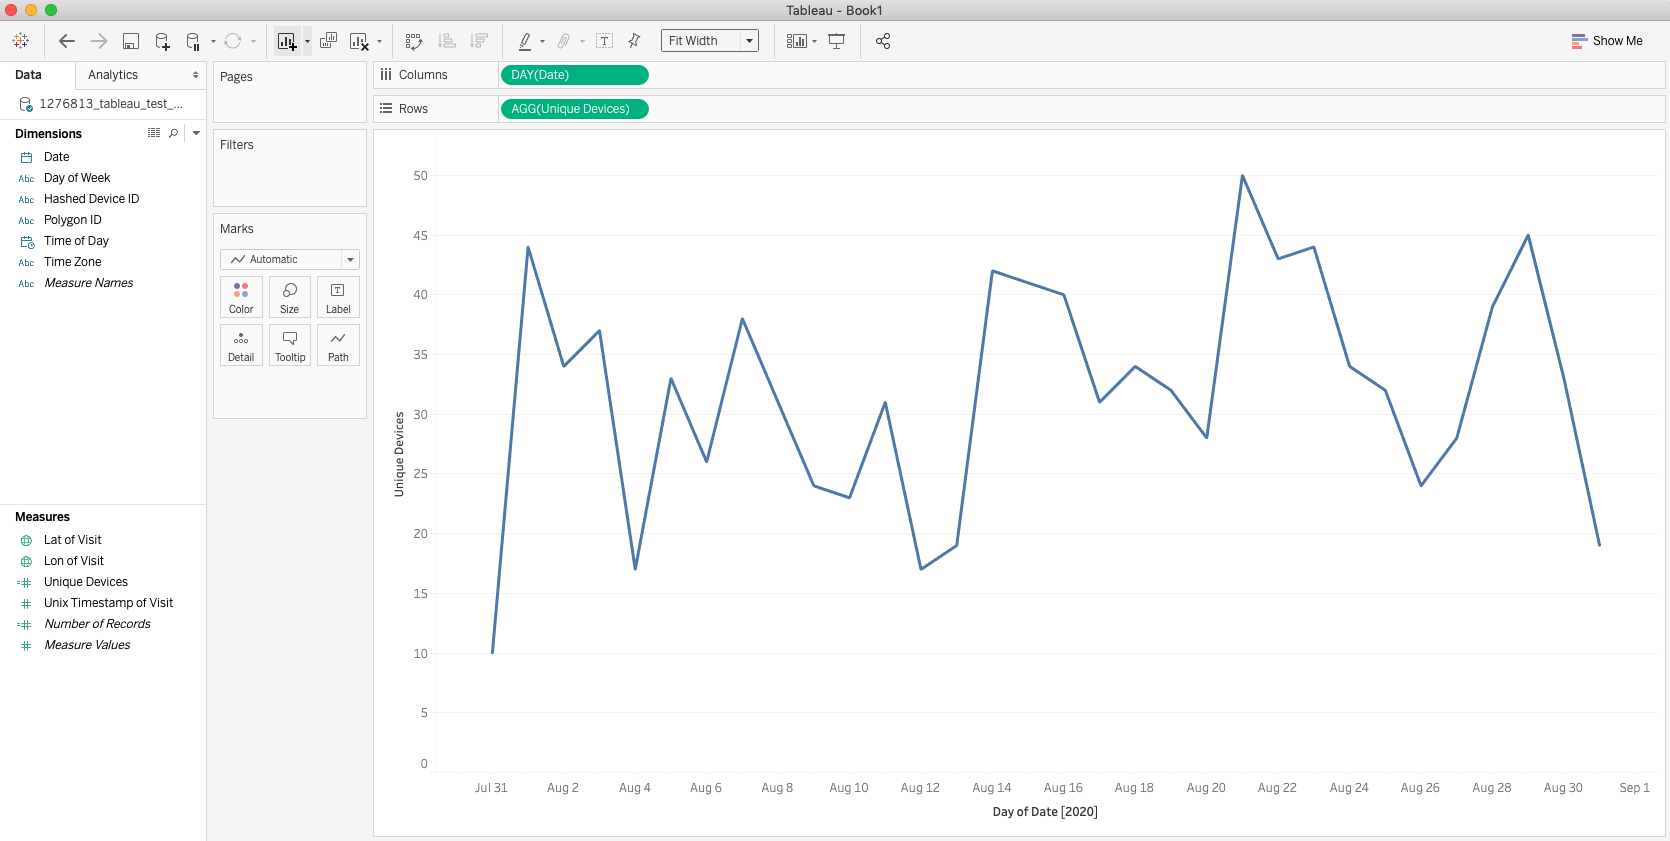
Now we can see how unique devices have traveled throughout our study time frame. Let's take a look at how hourly visitation looks like. As before, replace the Date pill with Time of Day in the Columns shelf and be sure to change it to a continuous hour.
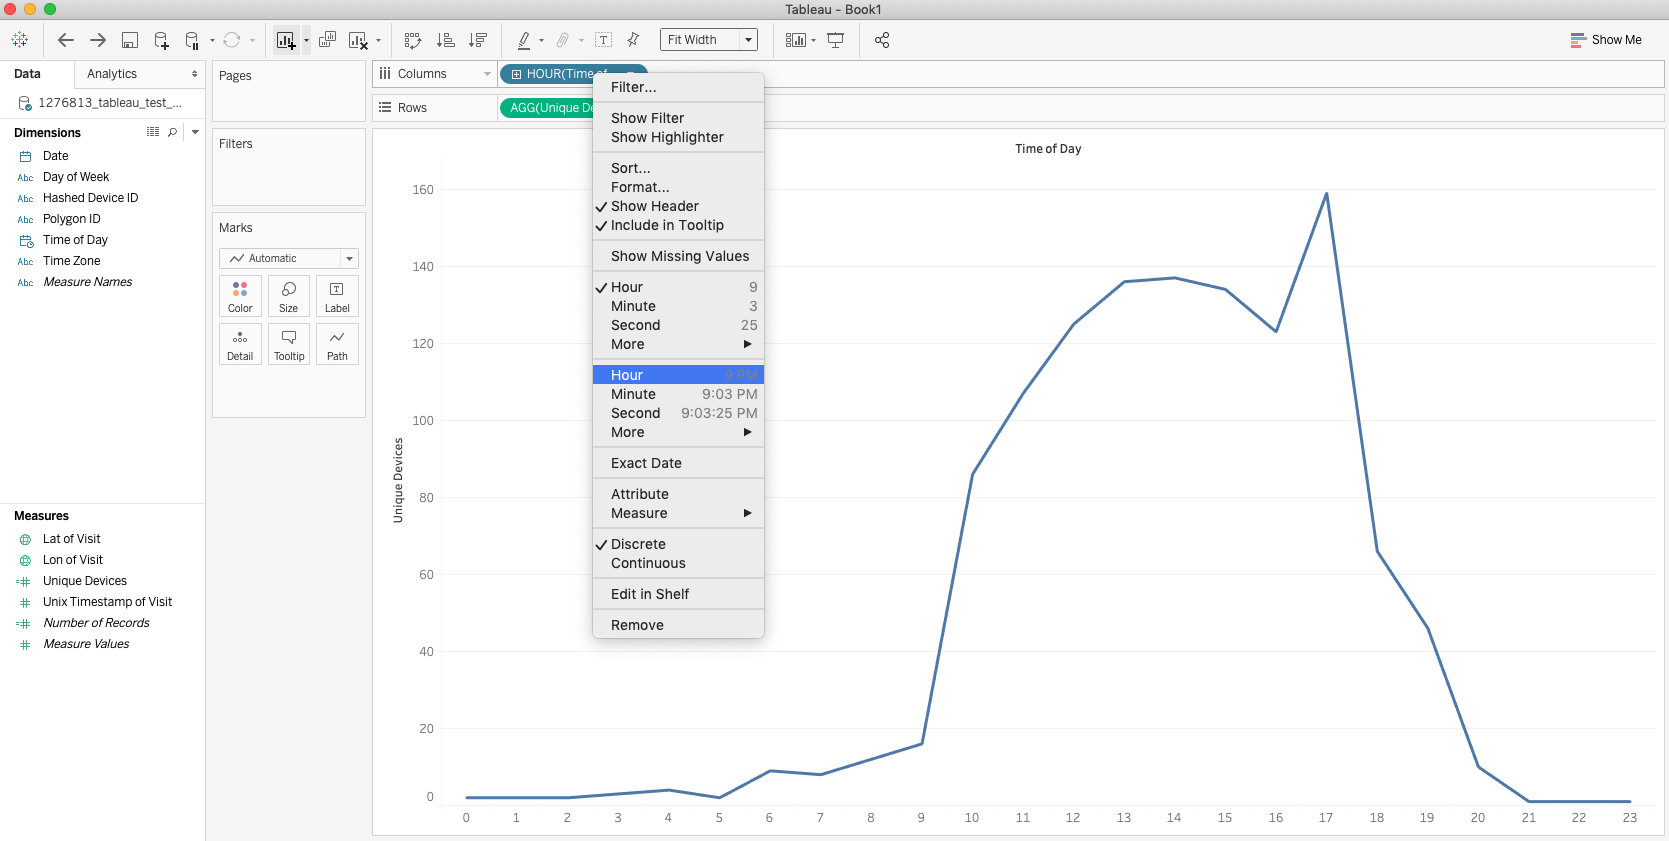
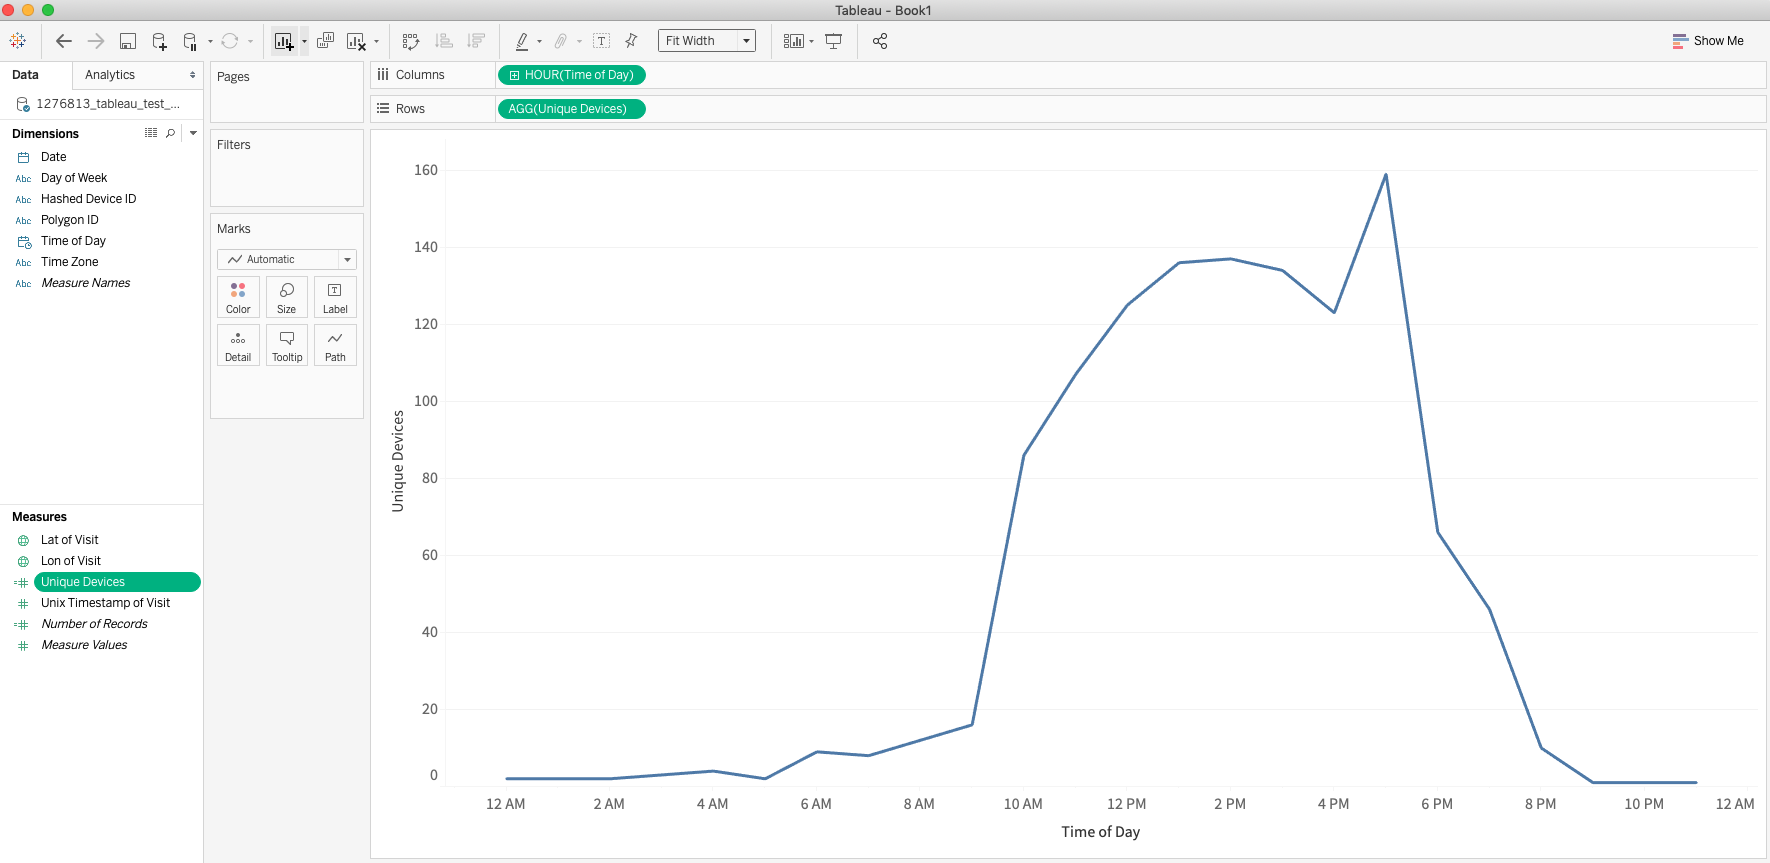
Now we have three different visuals that can be used to analyze visitation to your study location based on three different dimensions of time. Play around with the data, add filters and different elements to create a unique and insightful dashboard to share with your stakeholders.
For more information on Pin Reports please reference this page on Pin Reports
Insights provided by Azira in this study are aggregated and de-identified, not tied to any single device or individual. Azira adheres to GDPR and CCPA and has been certified for privacy compliance by Verasafe, an independent third party.
About the Author
Raul is Azira's in-house Tableau and ESRI expert with background in microbiology. He is passionate about using science and art to craft stories that excite and inspire, and wants to help you do the same.
